Dyschromatopsia — Vintage Market Find
February 10th, 2014 | Posted by in Uncategorized - (Comments Off on Dyschromatopsia — Vintage Market Find)Fish Eye Lens Dewarping and Panorama Stiching
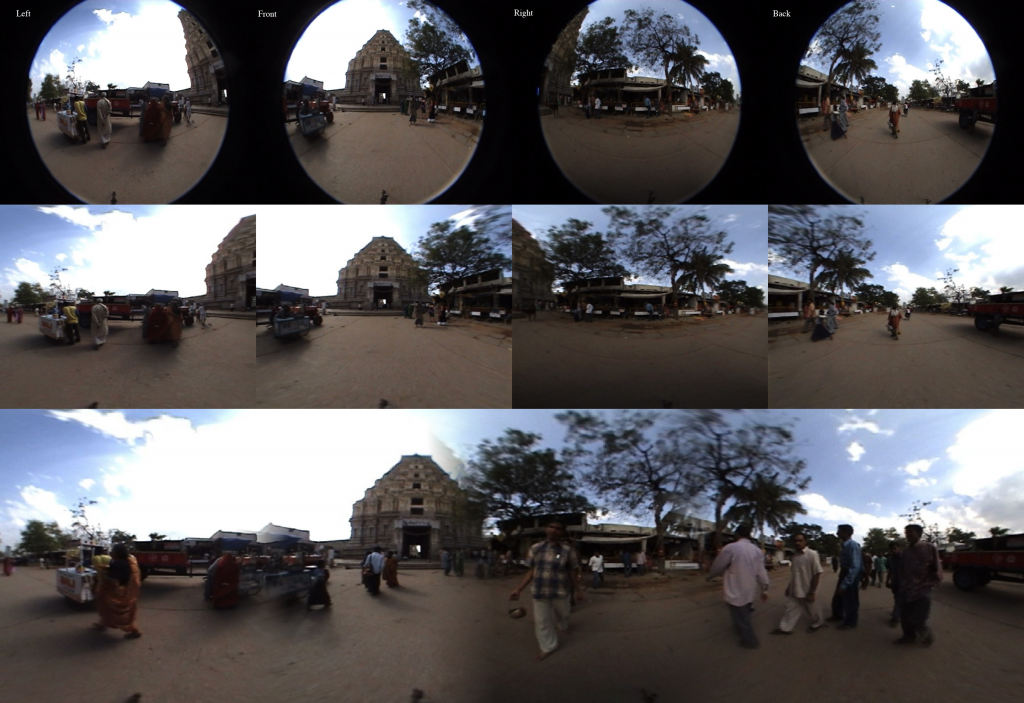
August 15th, 2013 | Posted by in code | computer vision | OpenCV | python | SimpleCV | Uncategorized - (Comments Off on Fish Eye Lens Dewarping and Panorama Stiching)I was challenged to see if I could create 360 degree view panoramas from a series of fish eye images taken at right angles to one another working from this tutorial. I modified the code from my 360 lens dewarping project to create the code for this project which you can check out here. There are roughly two types of fisheye images, circular fisheye lens that map a sphere onto the image plane, and full frame fisheye lens that map the input image to the entire rectangular image plane. The data I was working with was from a circular fisheye, which is significantly easier to reason about.
There are a couple of different ways you can approach the problem of fisheye lens dewarping. The first, and probably more robust approach is to develop a camera lens model that accurately represents the fish eye lens distortion, and apply that lens dewarping to the image. In the absence of a calibration data, particularly for full frame fisheye’s, you would then need to manually tune the camera model parameters to dewarp the image, or use some of the image data to get a back of the envelope approximation of the camera parameters. The second, and in my opinion the easier, albeit slightly less robust approach, is to create a mapping from the output image pixels in terms of phi and theta in a circular coordinate system, and map that to pixels in the input image. The basic idea is that in the output image each pixel represents some steradian on the input image. The best way to think about a steradian is as a “pixel” on the sphere, or the square mapped out by latitude and longitude lines. Each steradian then maps to a point on the image plane, which you can calculate by doing a spherical to Cartesian conversion and dropping the value that is in the normal to the image plane.
For example, in my code, I first create an output image and assume each x and y position on the image maps to somewhere roughly between 0 and 180 degrees (0,pi) for both phi and theta. In my model the direction pointing straight out of the camera is called y, so I then do a spherical to Cartesian conversion assuming a unit sphere. Since the unit sphere is at the origin, I shift the sphere and rescale it to be of unit length, and then multiply the result by the input image dimensions. An easier way to think of it is this:
Destination image pixel (X,Y) –> scale to unit length –> convert to between zero and pi –> do spherical to Cartesian conversion –> rescale to get values between 0 and 1 –> multiply by the input image dimensions to get input pixel (X,Y).
The map is a bit tedious to create, but once you have it, OpenCV can really quickly push pixels around and give you a result.
The next step was to do the panorama stitching. To do this I first matched ORB keypoint between two successive pairs of images. Since I knew the images were vertically aligned, all I needed to calculate was the x value that is the horizontal offset. To do this I used the median x difference between the two sets of points (the median in this case acts as a poor man’s RANSAC to remove outlier matches). I then used this x offset to construct an alpha mask that I could use to smoothly blur the two images together. I played with this for a little while and I found a nonlinear mapping seemed to work a lot better. There are some problems with the images as they don’t seem to be taken at the exact same time, but for a half a day’s worth of work I am very pleased with the results.
Dewarped Panoramic Images From A RaspberryPi Camera Module
August 12th, 2013 | Posted by in code | computer vision | demo | pics or it didn't happen | python | RaspberryPi | signal processing | SimpleCV | Uncategorized - (Comments Off on Dewarped Panoramic Images From A RaspberryPi Camera Module)I got back from my cross country trip and in my mail box was a brand new RaspberryPi camera module from Element14. I needed a chill night at home so I setup the camera module and decided to see what I could do with it. After upgrading my pi to the latest version of wheezy and doing the requisite setup for the camera and the wireless card I was getting images. The setup for the camera module is fairly easy and wheezy has a few really nice command line programs for capturing, compressing, and delivering images to a remote host. The RPI foundation has a nice tutorial here. I am *extremely* impressed with the quality of the RPI camera module, the image quality far exceeds that of the built-in cameras on my macbook air and my lenovo laptop. At full resolution the camera module’s image quality is akin to a point and shoot camera from a few years ago. Not a bad feat for $20.
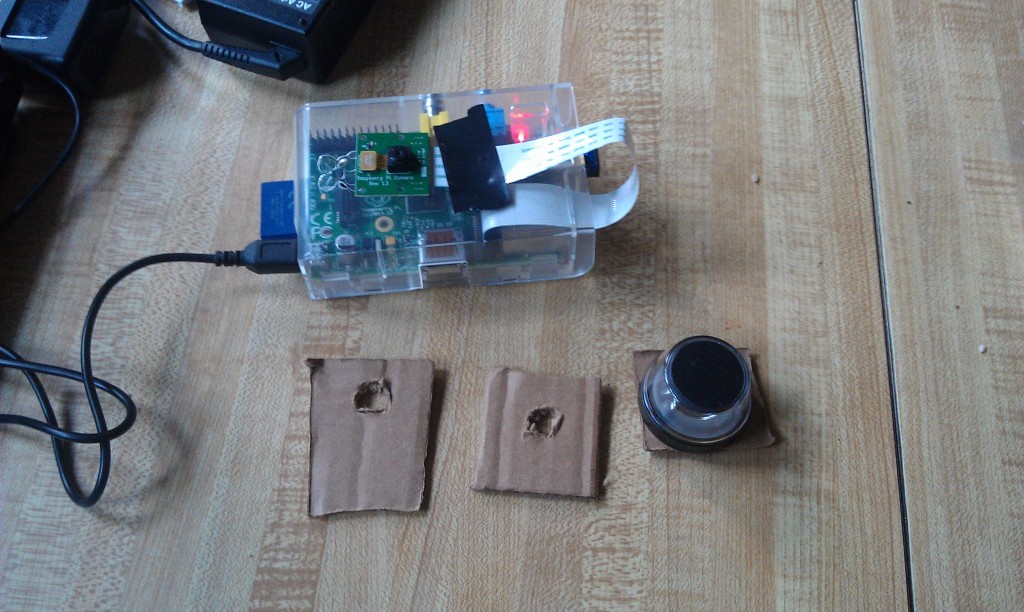
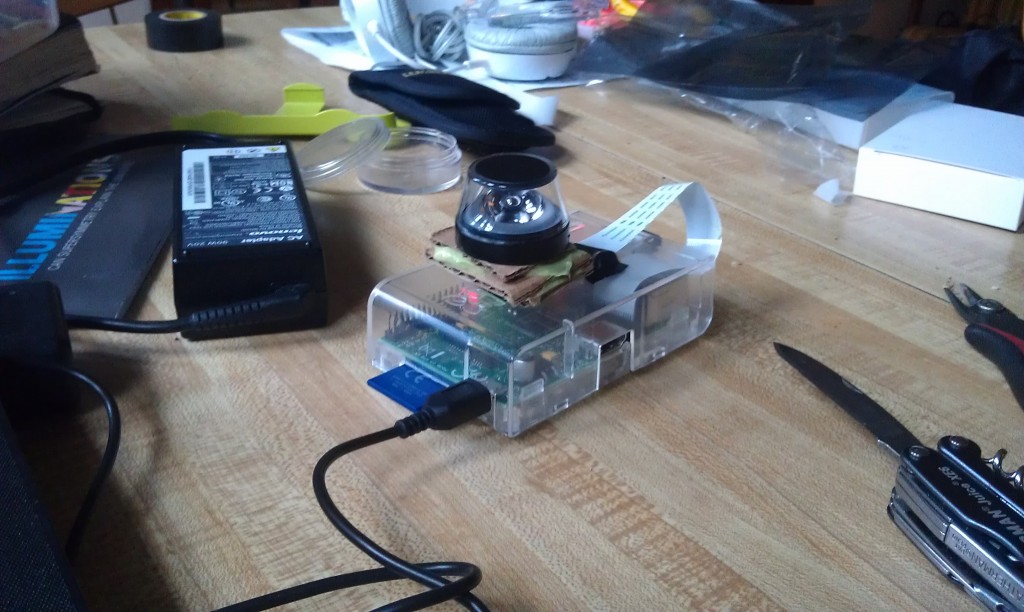
I wanted to do some interesting processing from the camera images. Given the performance of the pi using python I opted to look for an approach where I would use the pi as a dumb ip camera and process the images on the remote host. I remembered that I had a Kogeto 360 degree camera for iPhone in my basement. I don’t have or want iPhone so the lens was useless to me as is. After some careful twisting and prying I was able to remove the lens from the mount. I decided to whip up a quick adapter using just some silly putty and cardboard.
Since my RPI camera module is just loose, and not mounted to anything, I needed a non-destructive and quick way to attach the lens to the camera. I created three cardboard shims using my pocket knife, one that fit snugly to the camera, one that fit snugly to the protrusion on the lens, and one to space the two parts out. I used silly putty to “glue” the boards together while allowing me to slide them around to get the alignment just right. Silly putty works great for this as it is non-conductive and easy to pick out the RPI camera board without breaking it. Also cleans up fairly easily. After a little of trial and error I got a working prototype.
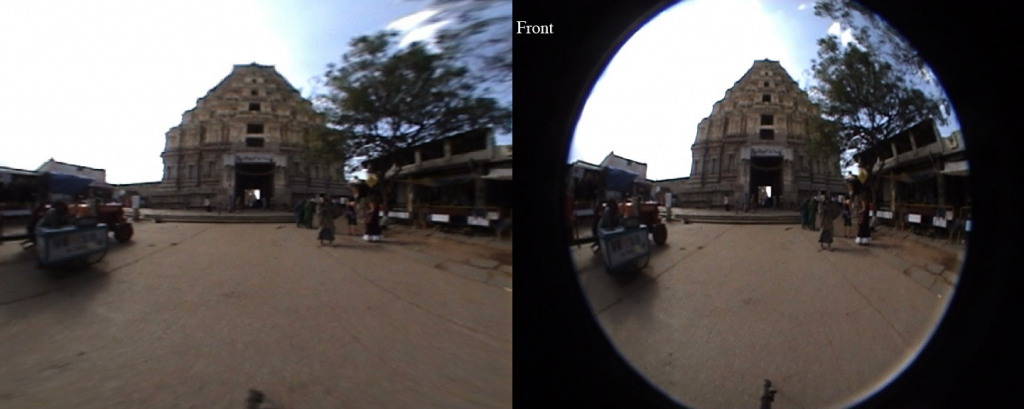
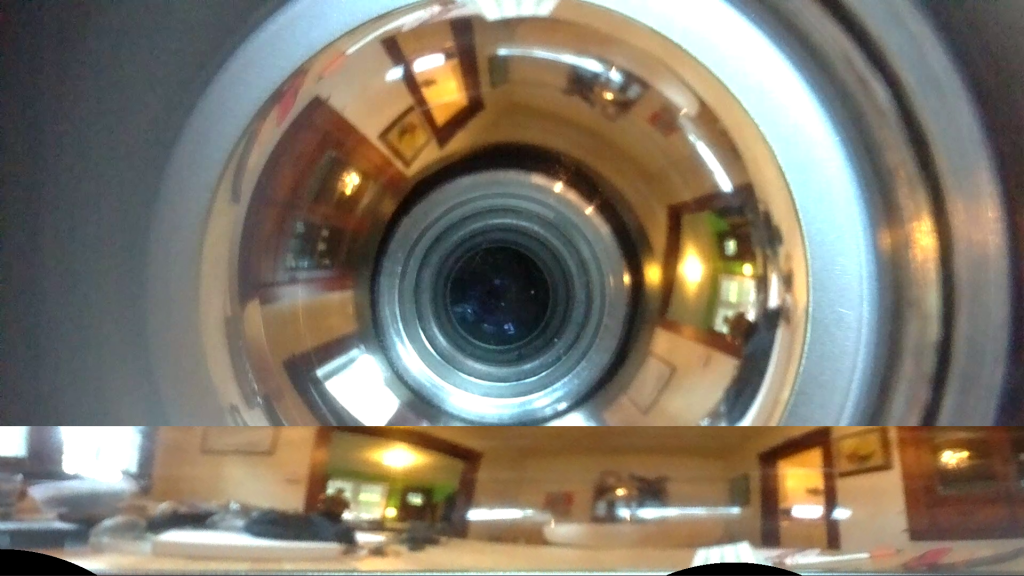
I switched on the raspberry pi and started getting images. The 360 degree camera doesn’t use the full image frame. Instead it projects a donut onto the image plane that we can dewarp to get a full panoramic image. The image below shows most of an input image with the dewarped result overlaid.
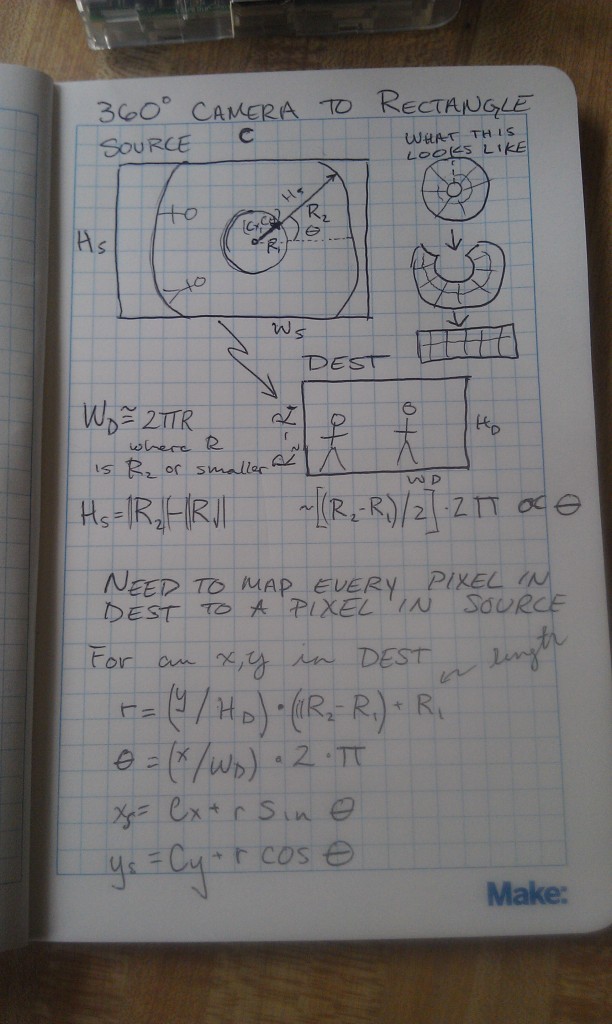
You can see that input image has a basically a “doughnut” where the actual image appears, the rest is just noise. You can see a minute of raw camera video here to get a better sense of what I mean. The trick to do the dewarping is to take that doughnut, put a slice in it, and uncurl it to a rectangle that looks like a normal image. To do this you need to figure out a couple things, the center of the doughnut, the radius of the “doughnut hole”, and the outer doughnut radius. Once you have this stuff the mapping for the camera is basically translating every point in the destination image to a point in the source image using a radial (r,theta) representation. I posted the notes from my notebook to give you a better idea of what I did.
I coded this all up in python using the cv2.remap function. For this function you just create a list of every pixel in your destination image and tell it where to point to in the source image. It takes awhile to create the map because I used naive python looping, but once the map is created the mapping can be done in nearly real time. I tossed the code into this github repo. It took me a bit of time to figure out that mapping was from destination to source versus the other way around. I am also still having some problems with encoding the output video so I just dumped them to file and had ffmpeg stitch them back together into a video. Here is my first draft of the code (a bit of a hack).
I used a quick command line ffmpeg call to stitch the still frames I produced back into a video so I could post it YouTube. This is a really neat feature of ffmpeg that has saved me quite a few times. the raw command is (avconv -r 32 -f image2 -i ./FRAME%05d.png -b:v 1024K output.mpeg).
Hopefully when I get some time later next week I will modify this script to perform dewarping on live streams from the RaspberryPi. I also would like to fab a legitimate adapter using a 3D printer. If I manage to get that done I will toss the design files in the github repo and thingaverse.
Hack the Museum
July 29th, 2013 | Posted by in audio | code | Detroit | Fun! | python | Uncategorized - (Comments Off on Hack the Museum)My friend talked me into participating in the HackTheMuseum hack-a-thon at the Henry Ford Museum during the Detroit Maker Faire. The hackathon was intended to feature a new API for the museum’s digital assets. We did a recon trip the week before the hack-a-thon and outlined what we thought would make a great app. The newer exhibits at the Henry Ford are actually really slick. You can search through the physical and digital collection and curate collection via large touch screens installed in the museum for later retrieval at home. After our recon trip we distilled a few key design elements that we wanted in our app.
- We specifically didn’t want to duplicate the functionality of the existing infrastructure. Given the time constraints we really couldn’t do it better.
- We noticed a couple of visually impaired visitors who could of benefited from audio tours. The Henry Ford Museum doesn’t currently have audio tours like a lot of other tours.
- We didn’t want to write a mobile application. People go to museums to experience artifacts they can’t see anywhere else. The museum should be for enjoying these objects, not staring face-down into a cell phone or iPad.
- The museum sees a wide variety of visitors. Visitors of all ages, nations, ages, races, capabilities, and socio-economic status. We didn’t want to assume that our users had expensive cellphones with equally expensive data plans, or the tech savvy to operate them. My experience is that my parents, the kids I couch, and my family can all operate mp3 players and MMS text messages. We wanted to stick to a medium that could see wide adoption.
- Every good idea we had some sort of mapping element which really isn’t available in the Henry Ford Museum API. Every experience we could think of started with, “Where is cool thing X at the museum”. Having a map is an indispensable part of the museum experience. There is simply too much to see in one day, you pick the stuff that really interests you.
The night before the hack-a-thon I thought up an idea that I pitched to the team. The idea was to create custom maps and audio tours for the museum and then deliver them via a diversity of mediums. Have a smartphone? Great, here is a map image or dynamic map and a SoundCloud link / dynamic HTML audio. Have a dumb phone? Get the content delivered via SMS message. Are you a teacher who wants to customize a visit? Awesome, dumb mp3 players are dirt cheap, you can get a set for a classroom for half the price of one iPod. You can load up a tour and hand it over to the kids.
When the hack-a-thon started we decided to narrow our focus to a single exhibit so we could do the mapping and build out the content at least reasonably well. We needed to manually determine the positions of a bunch of exhibits. I started out by figuring out how to do the text to speech. My first task was to get the data I wanted to put in the tour from the museum API. After a bit of massaging I was able to pull out the data I wanted from the API. I settled on the exhibit location descriptions, display titles, the various abstracts/copy about the artifacts, and the thumb nail images. I wrapped this into a function that would pull down this info based on an id number. I then made another function that would stitch together various bits of text into a cohesive body text.
Python is my preferred hacking language of choice so I needed to figure out how to take the large body of text I could generate and spit it out as text to speech. There is pyttsx for text to speech, but it only outputs to the sound card. You could probably snag the raw wav data with a bit of hacking but that I would take awhile. There are also a bunch of APIs but I figured I could do decent job locally, also I had hopes to compose the text to speech with audio from the API but that never materialized. I decided to just use the python subprocess module to call the espeak linux command line utility to generate the speech wav files. I then ran ffmpeg over the raw wav files to convert them to Mp3. Finally I used the SoundCloud API to upload the output WAV file. Pretty? No, but it worked, that’s why they call it a hack-a-thon.
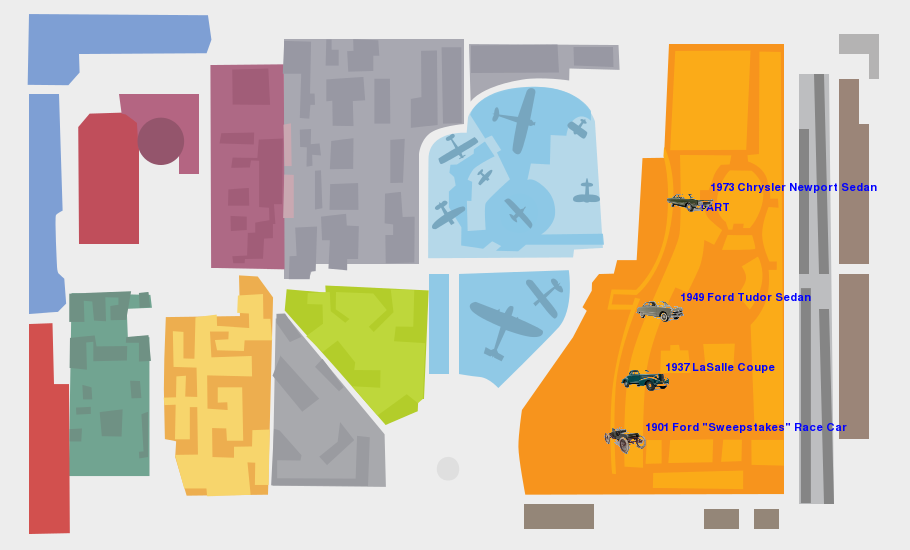
With the sound data taken care of I then proceeded to work on mapping. I had already pulled down the exhibit thumbnails so I all I had to do to position them on map was to map the exhibit location to the map. I just tossed our hand rolled map points into a python dict keyed on ID and made it a class member. Serious duct tape coding to be sure, in real life the museum would provide this info or you could toss it in your favorite data store. I then used a bit of SimpleCV magic to build alpha maps of the thumbnails and blit them onto the map. I also played with generating an animated gif of the the tour, but a lot of gifs were really big even after I ran them gifsicle. Gifs don’t render on old cell phones and imgur kept shitting the bed on big files so I cut it.
.@kscottz here is your Henry Ford #HackTheMuseum Audio tour: http://t.co/uJ36o7yEqE and map http://t.co/S46tJNPR75
— Katherine A. Scott (@kscottz) July 28, 2013
To deliver the content I used the Twitter API and the Twilio API. Twilio delivers data via SMS but not MMS so I was also hoping to use the MoGreet API to deliver images and sounds directly but I just plain ran out of time. I had some bits of code for the Twilio API so I just stuck with it. The last step was to link all of the front end UI with the back end bits. To do this I just used the python BaseHTTPRequestHandler and HTTPServer.
Like I said, it isn’t pretty but it works. That is why they call it a hack-a-thon. You can check out the code on Github. The Henry Ford Museum Asset API is only available within the museum so I grabbed a screencast video (sorry no audio). You can also hear some of the auto generated audio above.
We did reasonably well all things considered. We tied for second place at the hack-a-thon and I got a swell hard hat and few tickets to the Henry Ford Museum and Greenfield Village. The entire team did a great job. It was our first hack-a-thon ever, and we were reasonably front end heavy, and I have a minimal back end experience.


